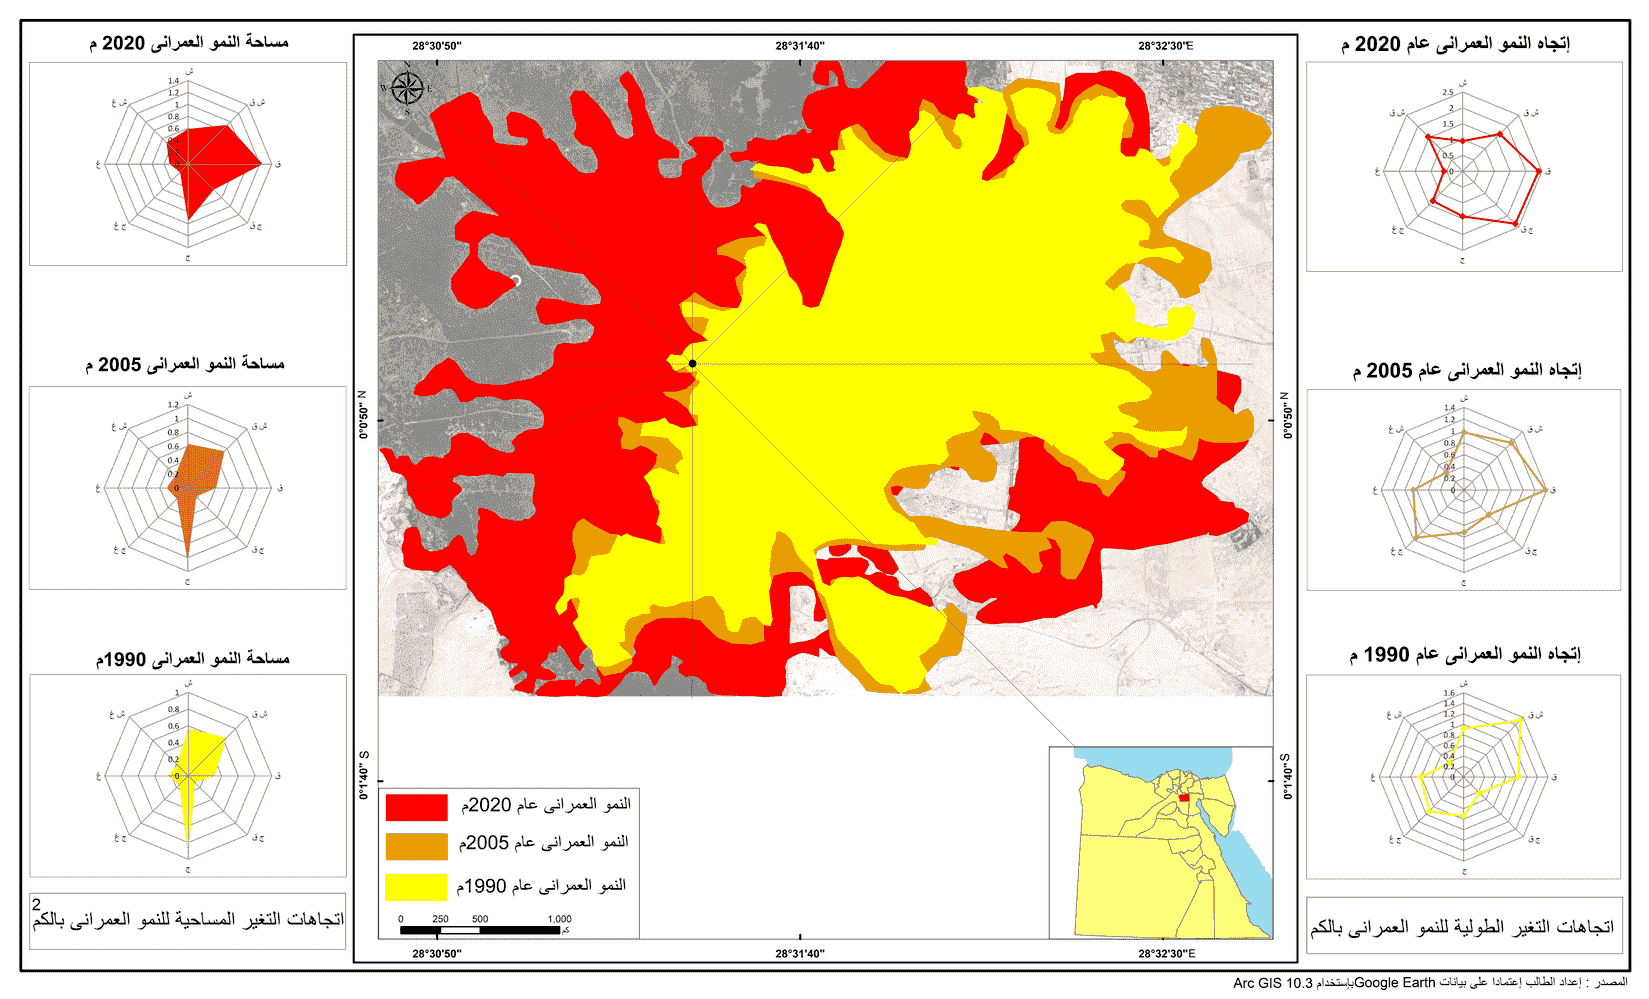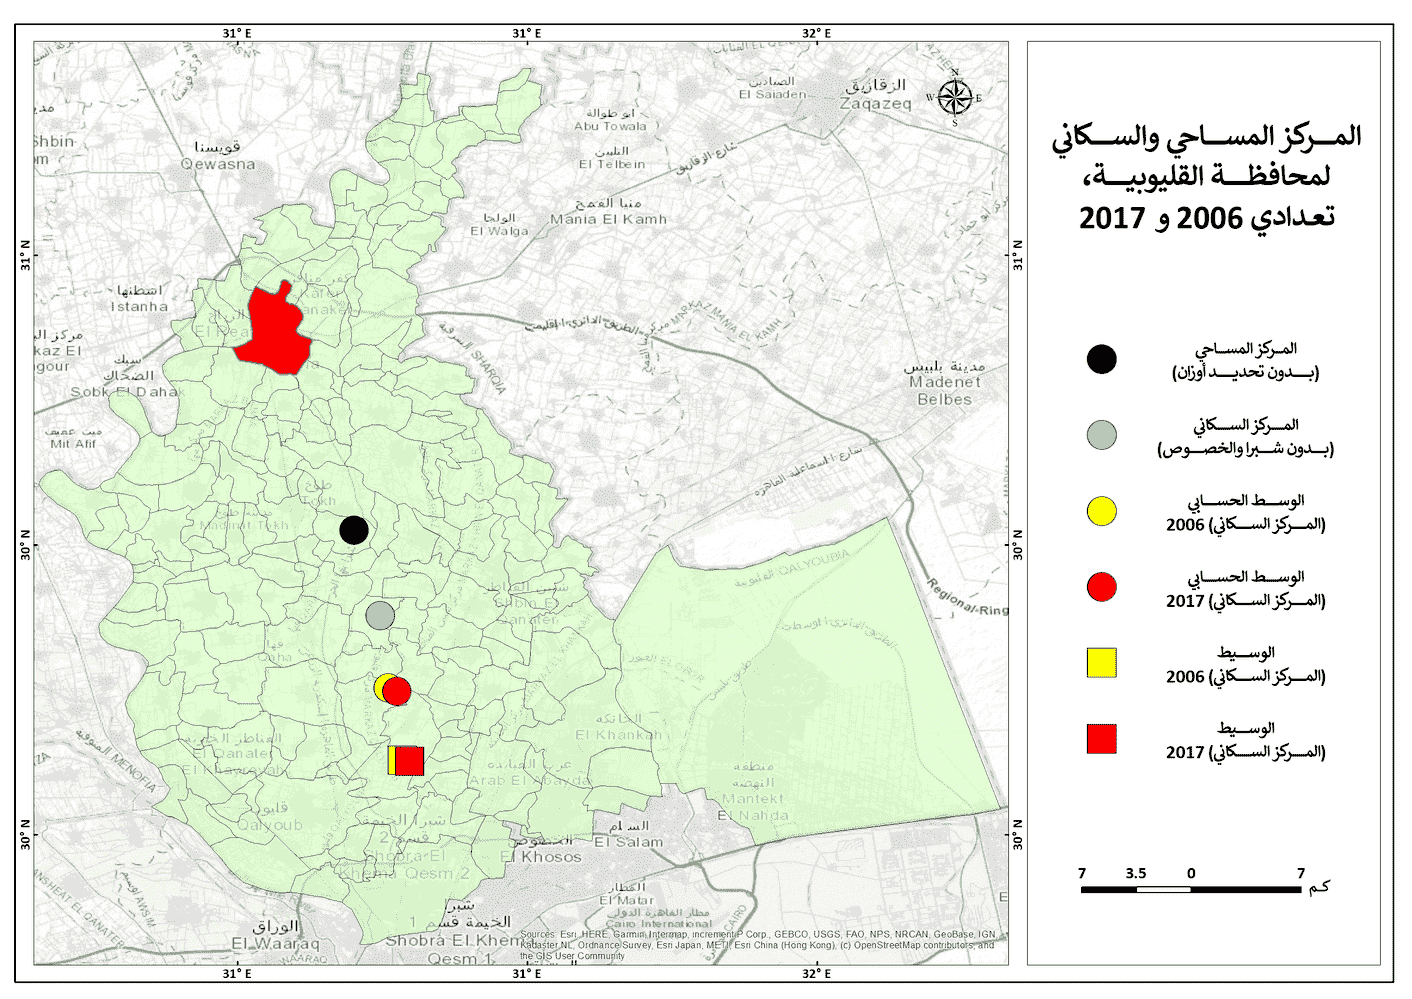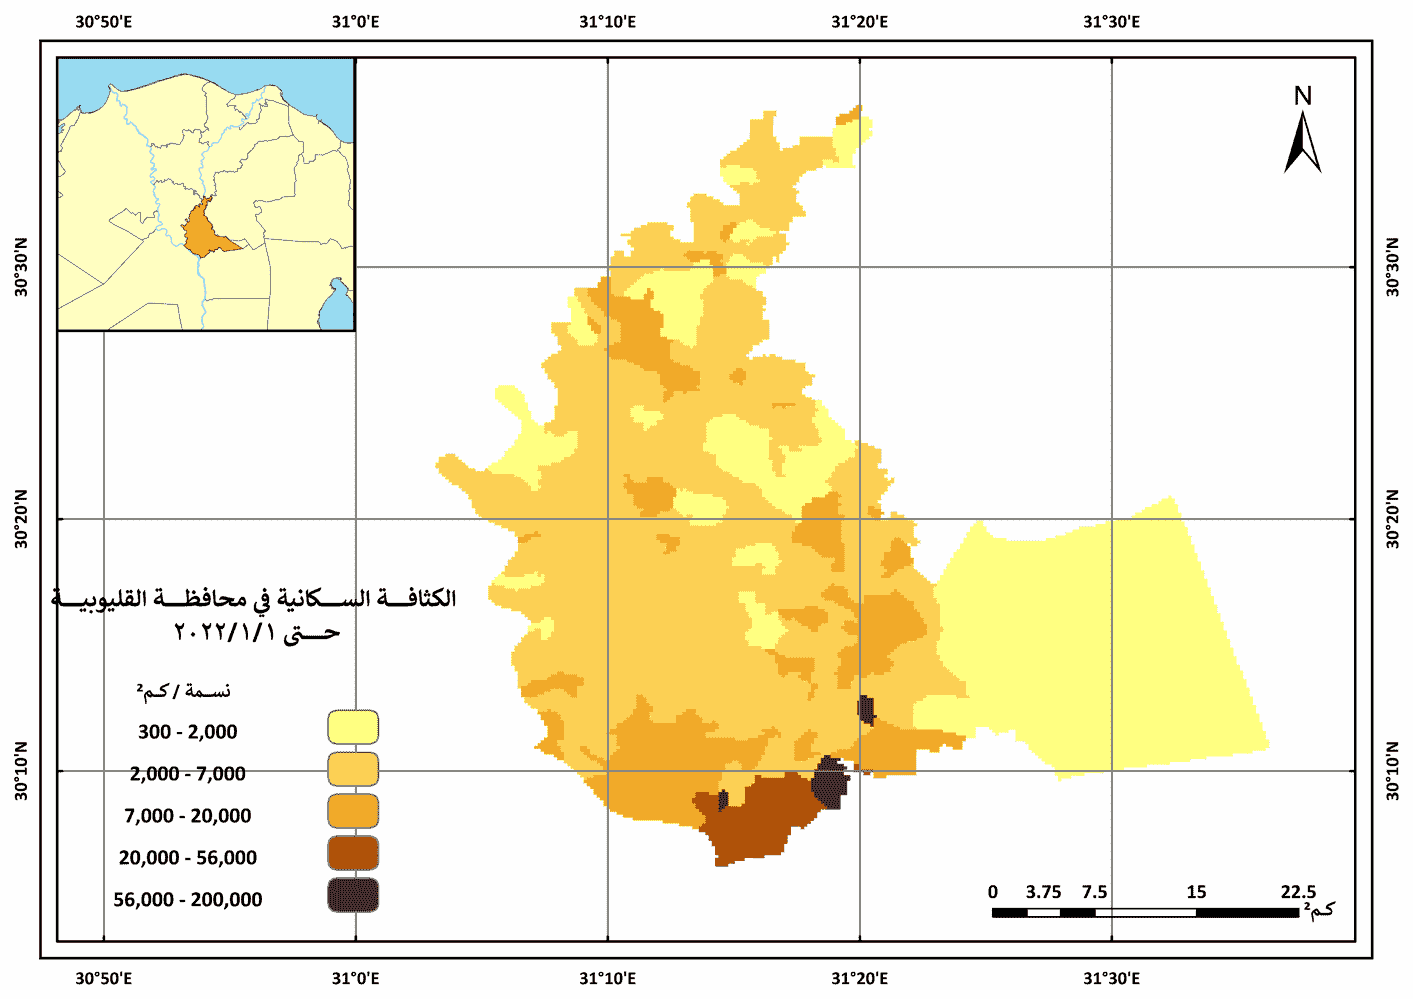

+3 years of extensive experience in Producing Maps, Digitizing, Analyzing Spatial Data, and Automating Geospatial Processes. Good working experience in Data Reviewer, Topology, ModelBuilder, Cartography, and Layout. Solid knowledge and understanding of GIS software like ArcGIS products and QGIS. Also, RS software like Envi and Erdas Imagine. Responsible for managing Web Servers, Hosting, Domains, and WordPress edits in cPanel & hPanel. Also, Responsible for managing the team and overseeing all project phases from inception to delivery. Here is what I can do :
Also I am good at :
💠 Spatial statistics and modeling
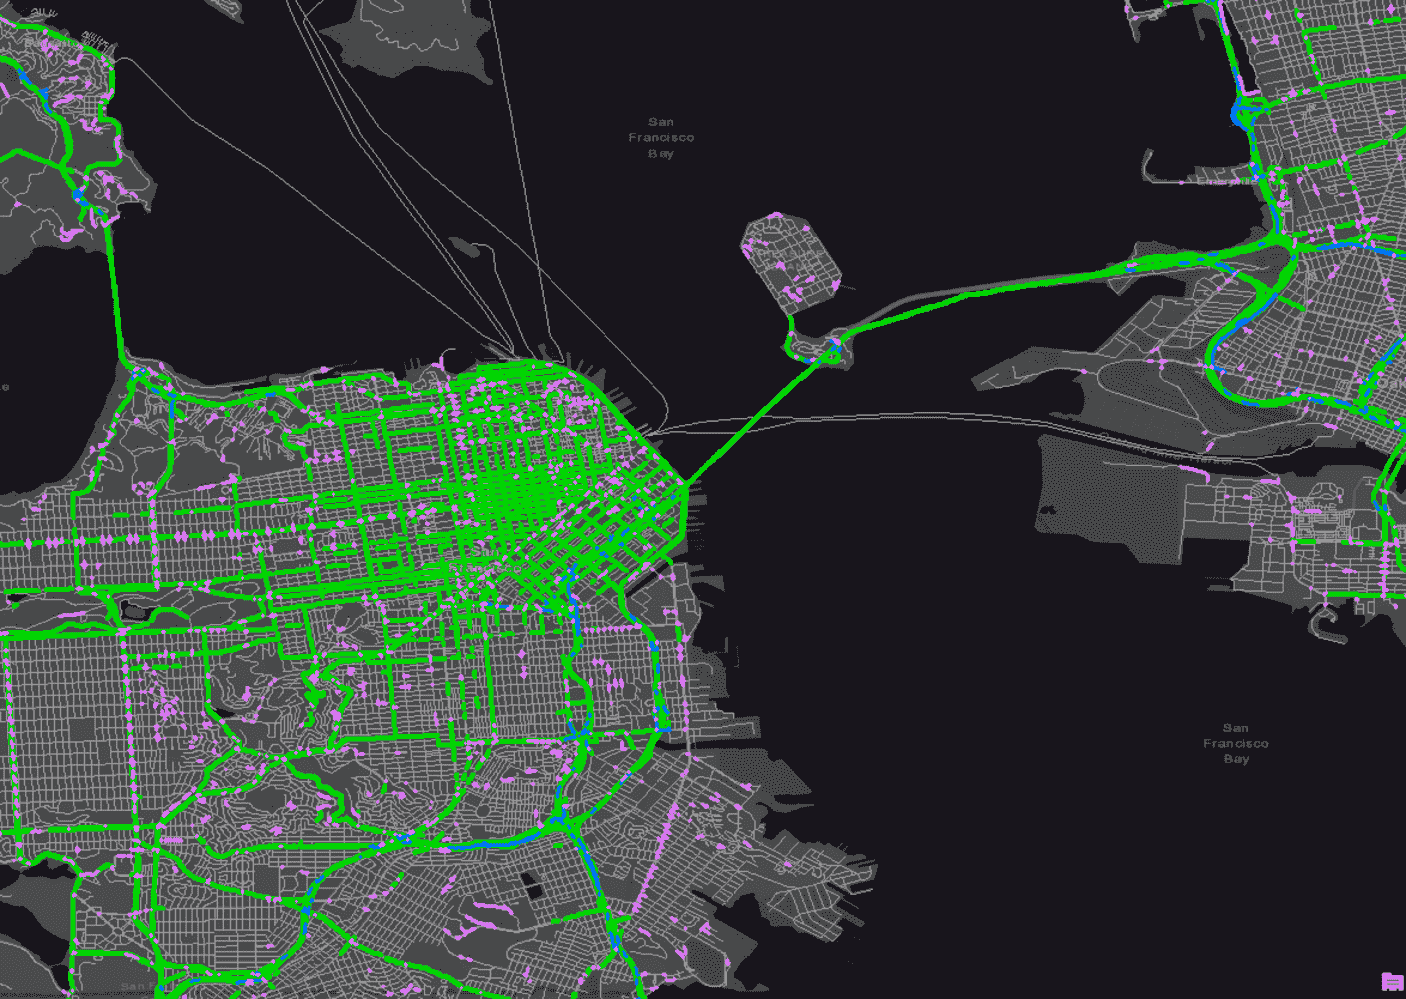
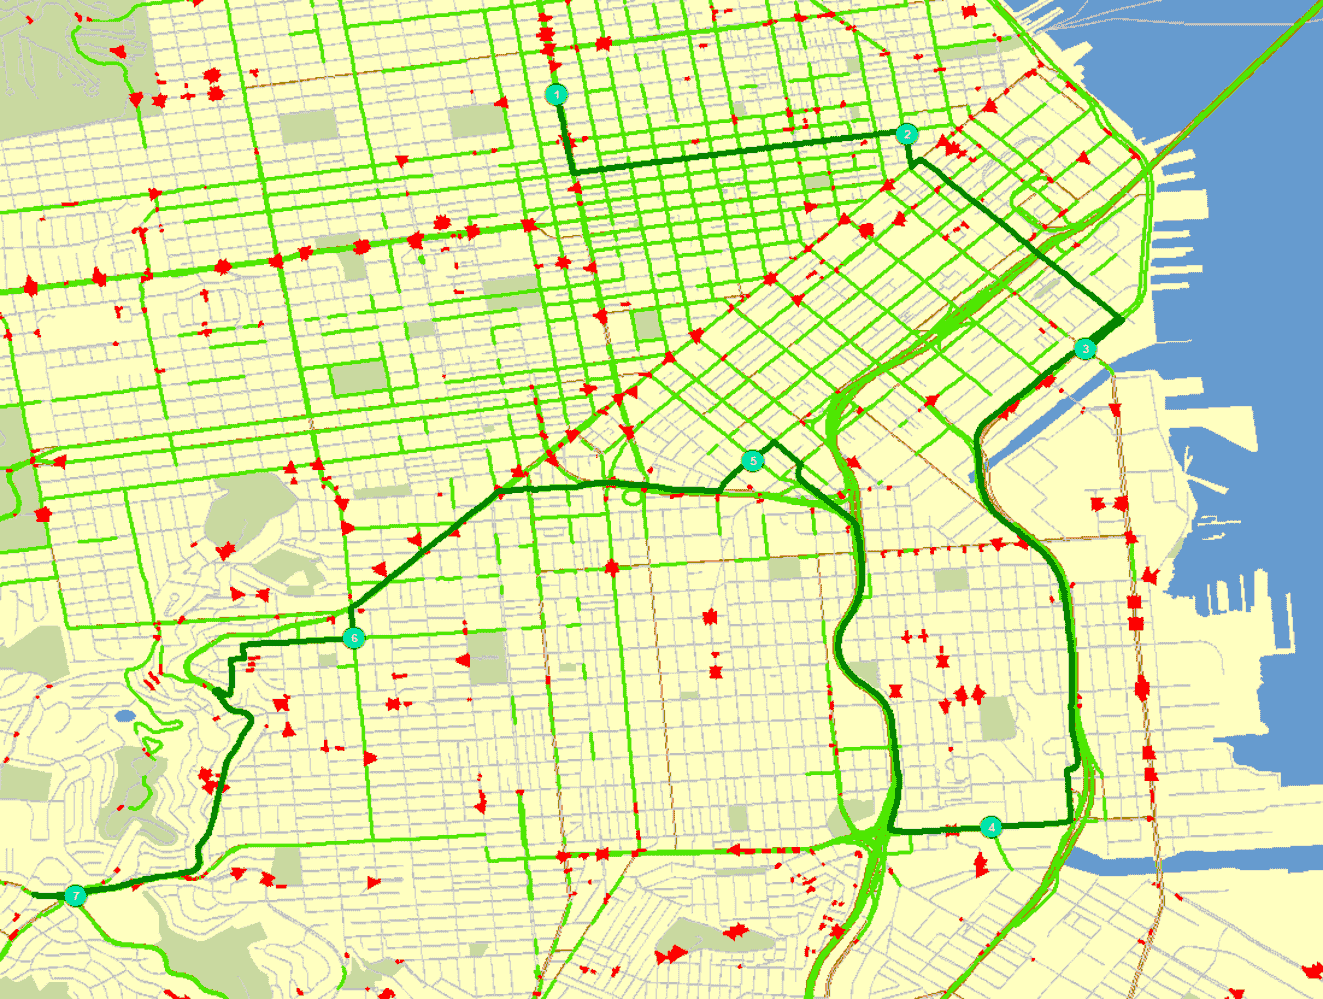
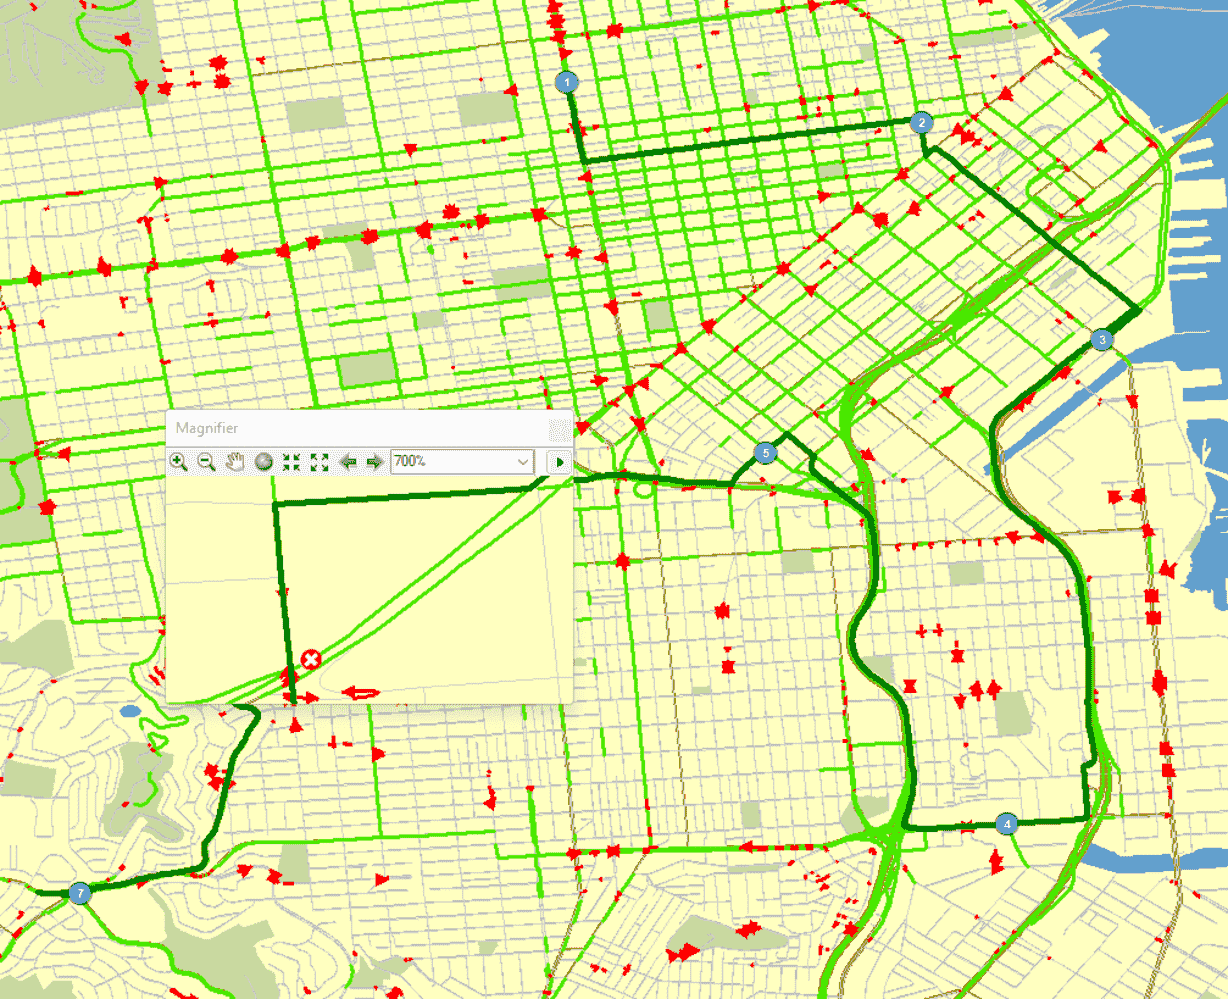
💠 Network and routing analysis
💠 Land use and land cover analysis
💠 Demographic and market analysis
💠 Proximity and accessibility analysis
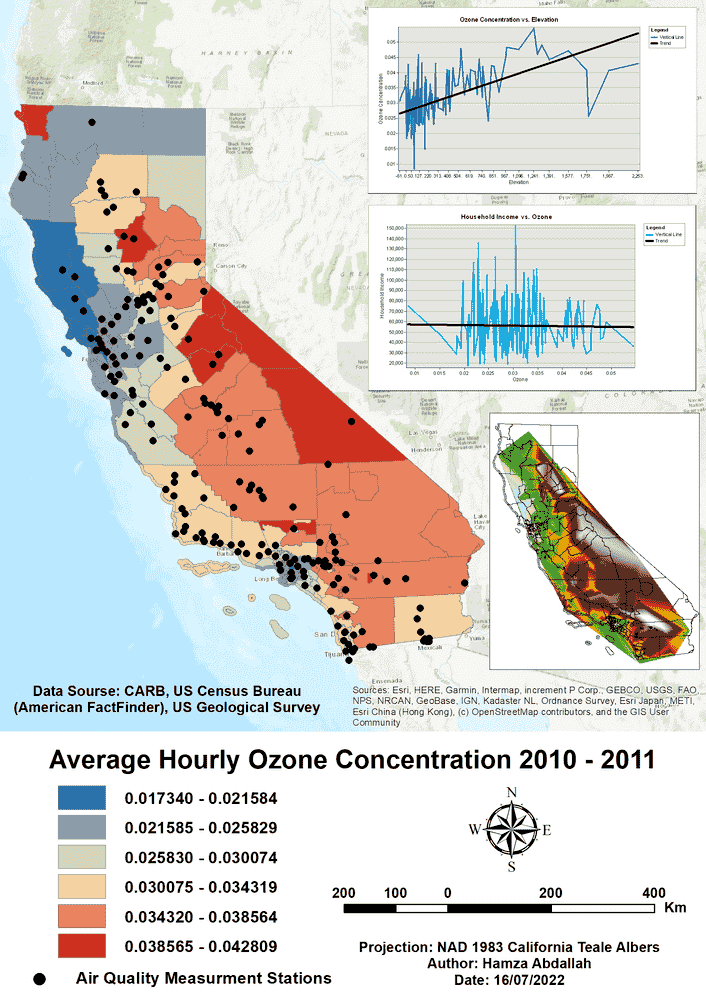
💠 Environmental and climate change analysis
💠 Custom map creation for digital and print formats
💠 2D and 3D map representations
💠 GIS data analysis and visualization
💠 Cartographic design and principles
💠 Interactive and web map design
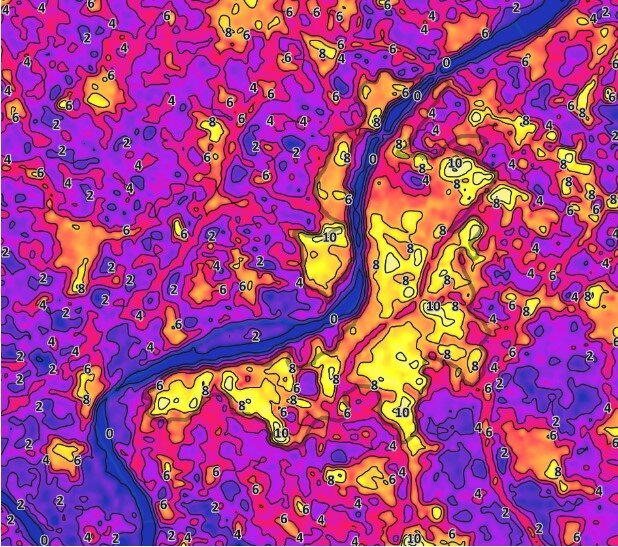
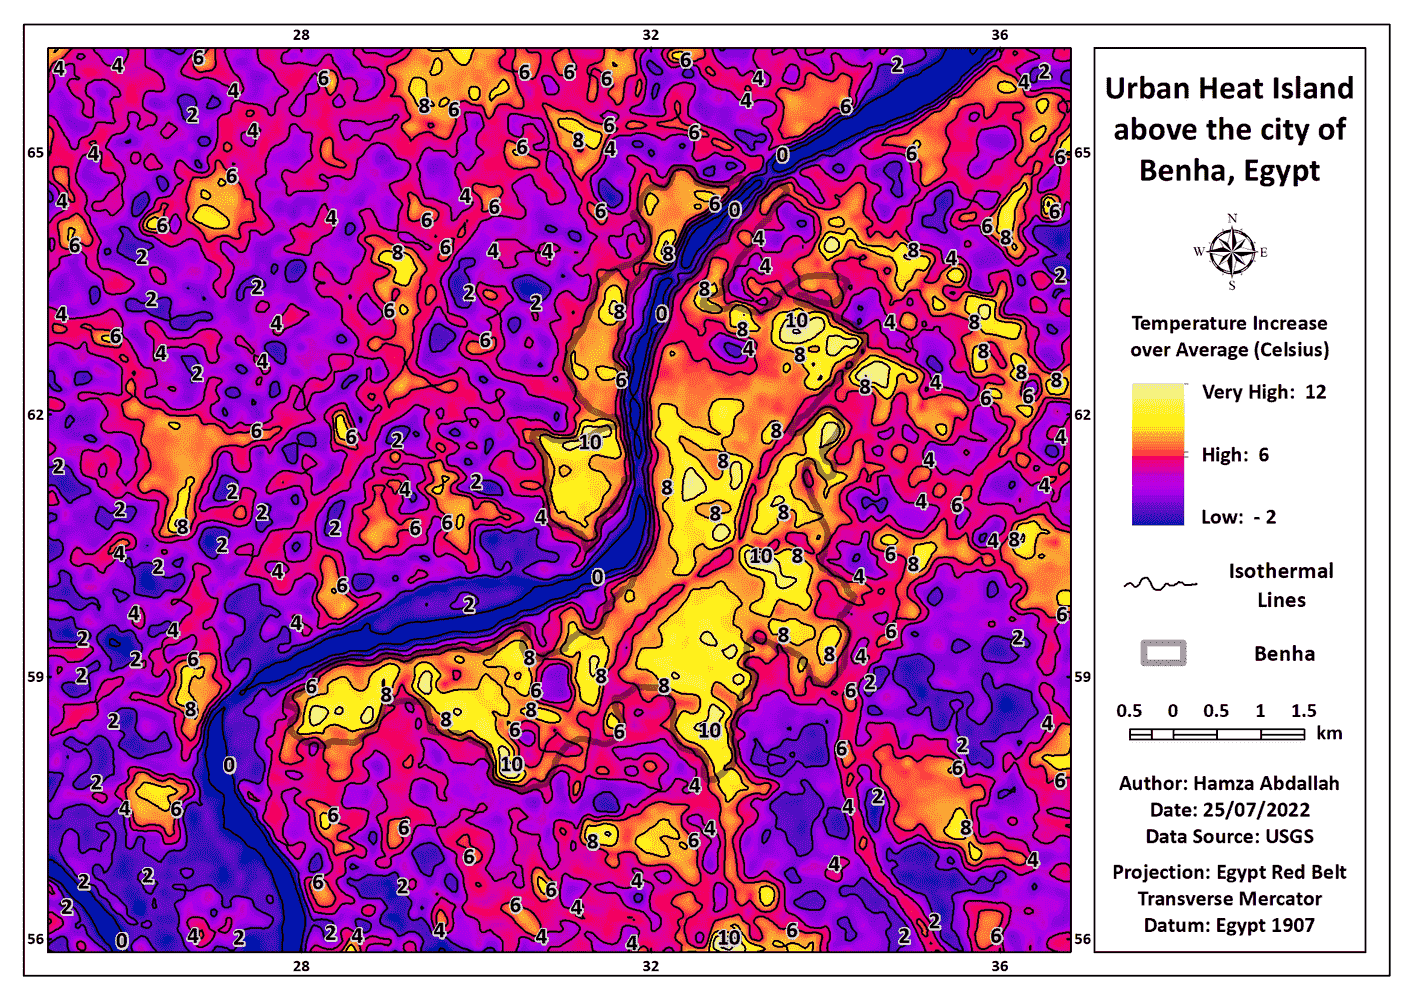
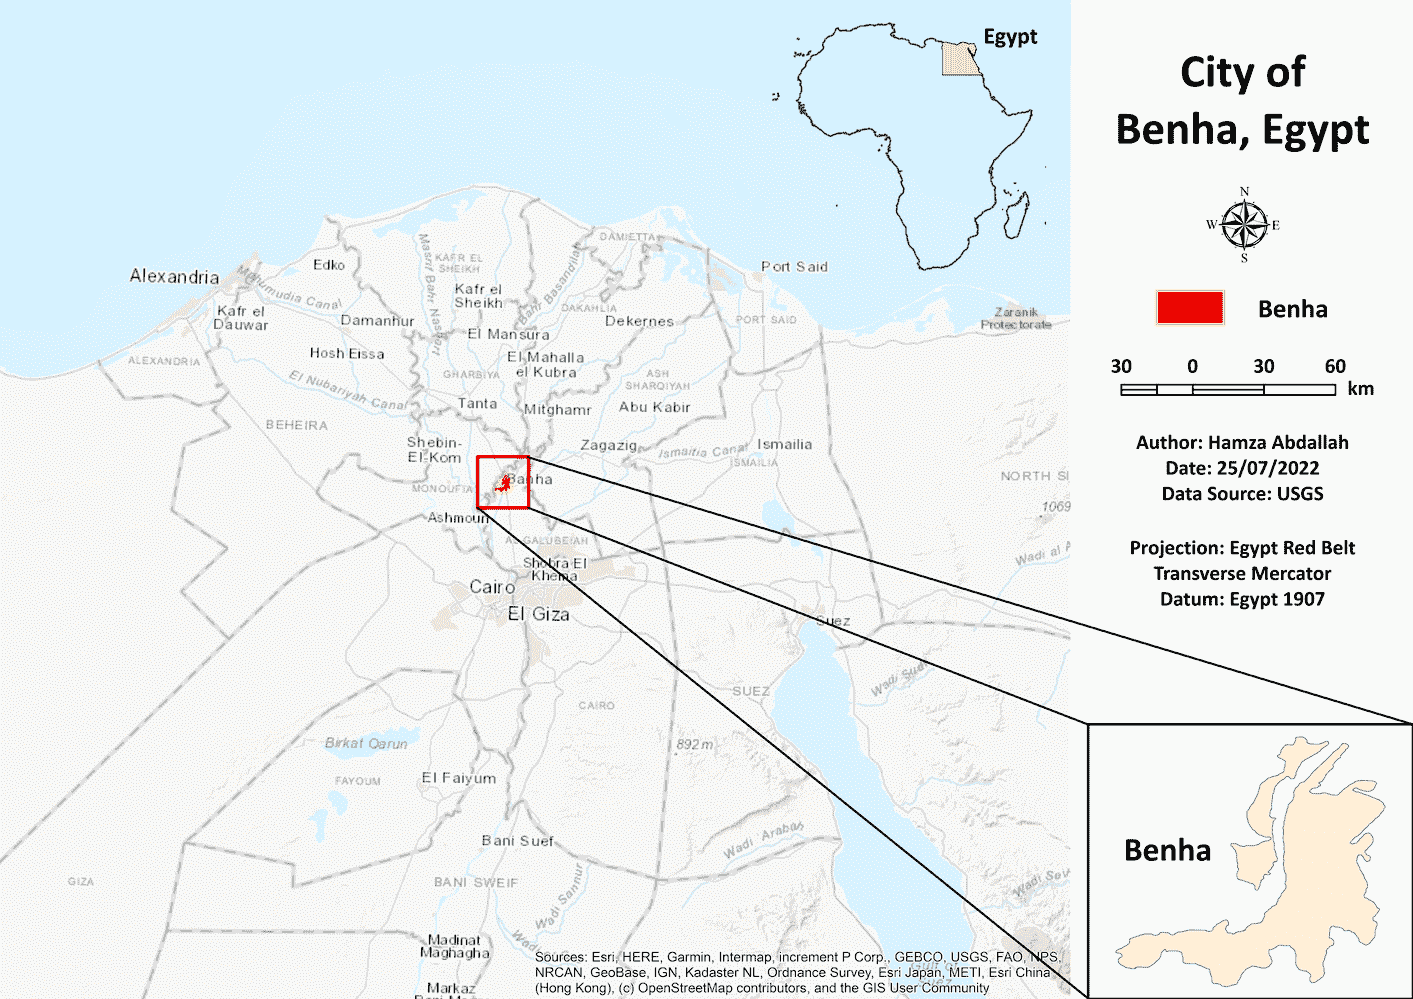
Urban Heat Island (UHI) above the city of Banha, Egypt
When your weather app tells you it's going to be a hot day, you might think it'll be a hot day for everyone in your city. But street configuration, building materials, vegetation, and closeness to a body of water significantly impact how city residents experience the weather. A hot and sunny afternoon in a neighborhood wrapped in mature trees and with canopy cover may feel quite pleasant. But a street surrounded by parking lots and concrete apartment buildings could be scorching.
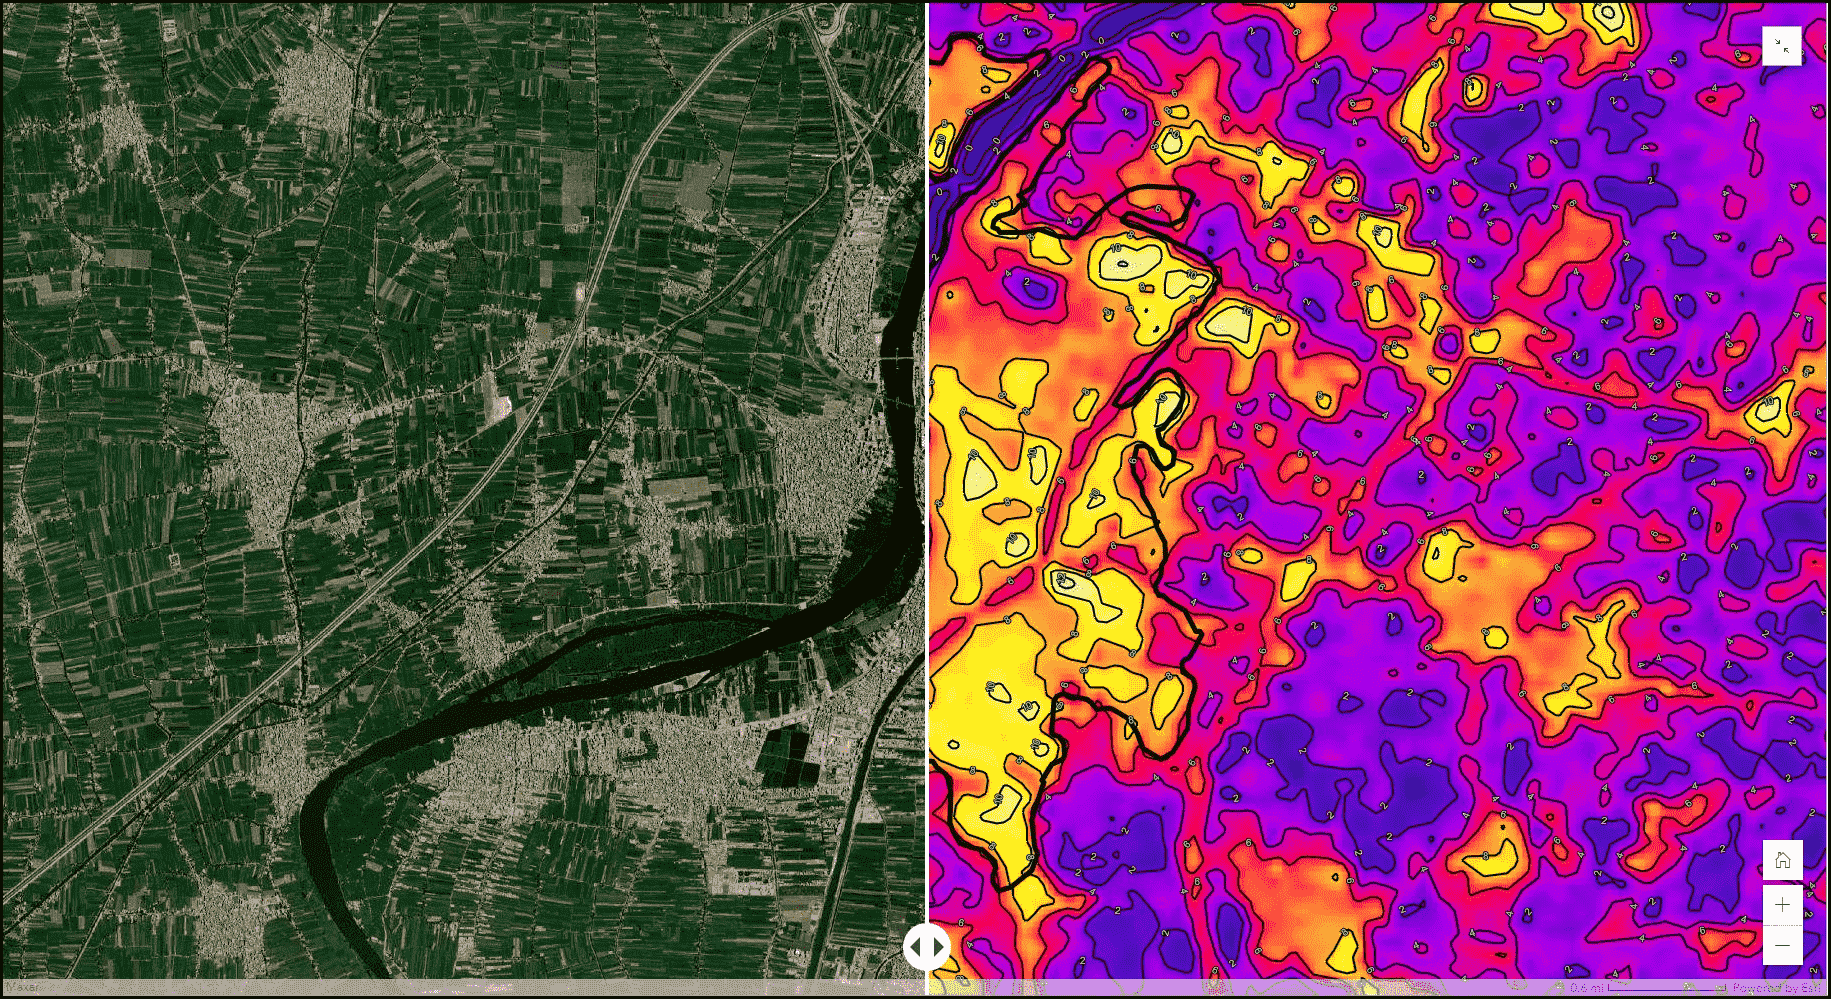
This project proposes to explore the possibility of using publicly available satellite imagery to monitor changes in temperature inside and outside the city by analyzing heat band 10 from Landsat 8 - OLI satellites in USGS Earth Explorer and accessing the air temperature inside the city to add many more parks and trees in the future to reduce altitude increasing in temperature.
Open Project Open PDF
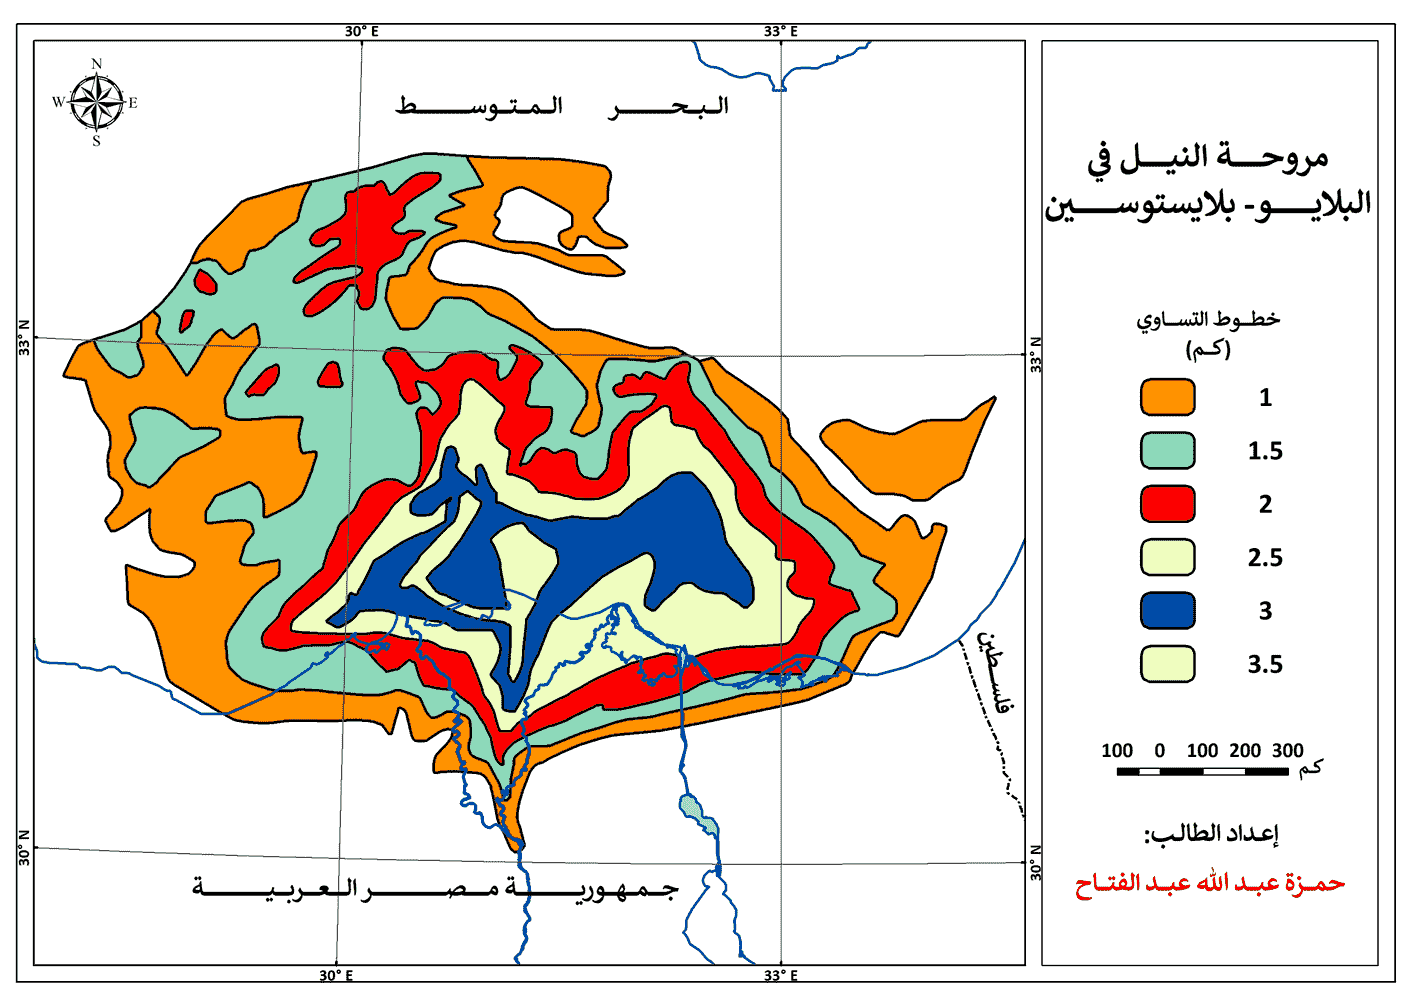
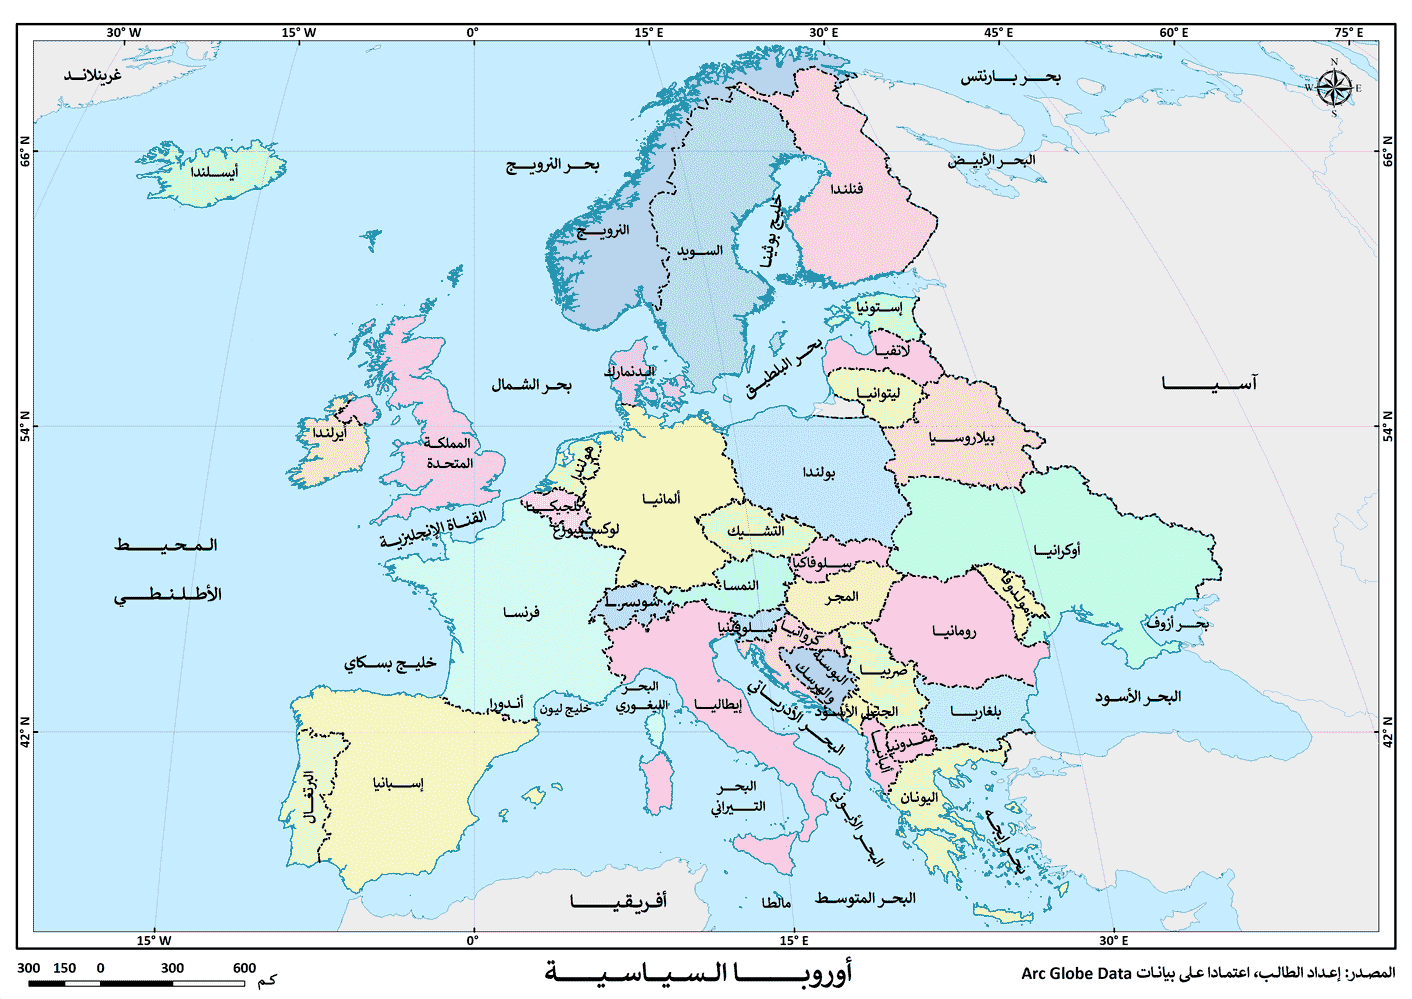
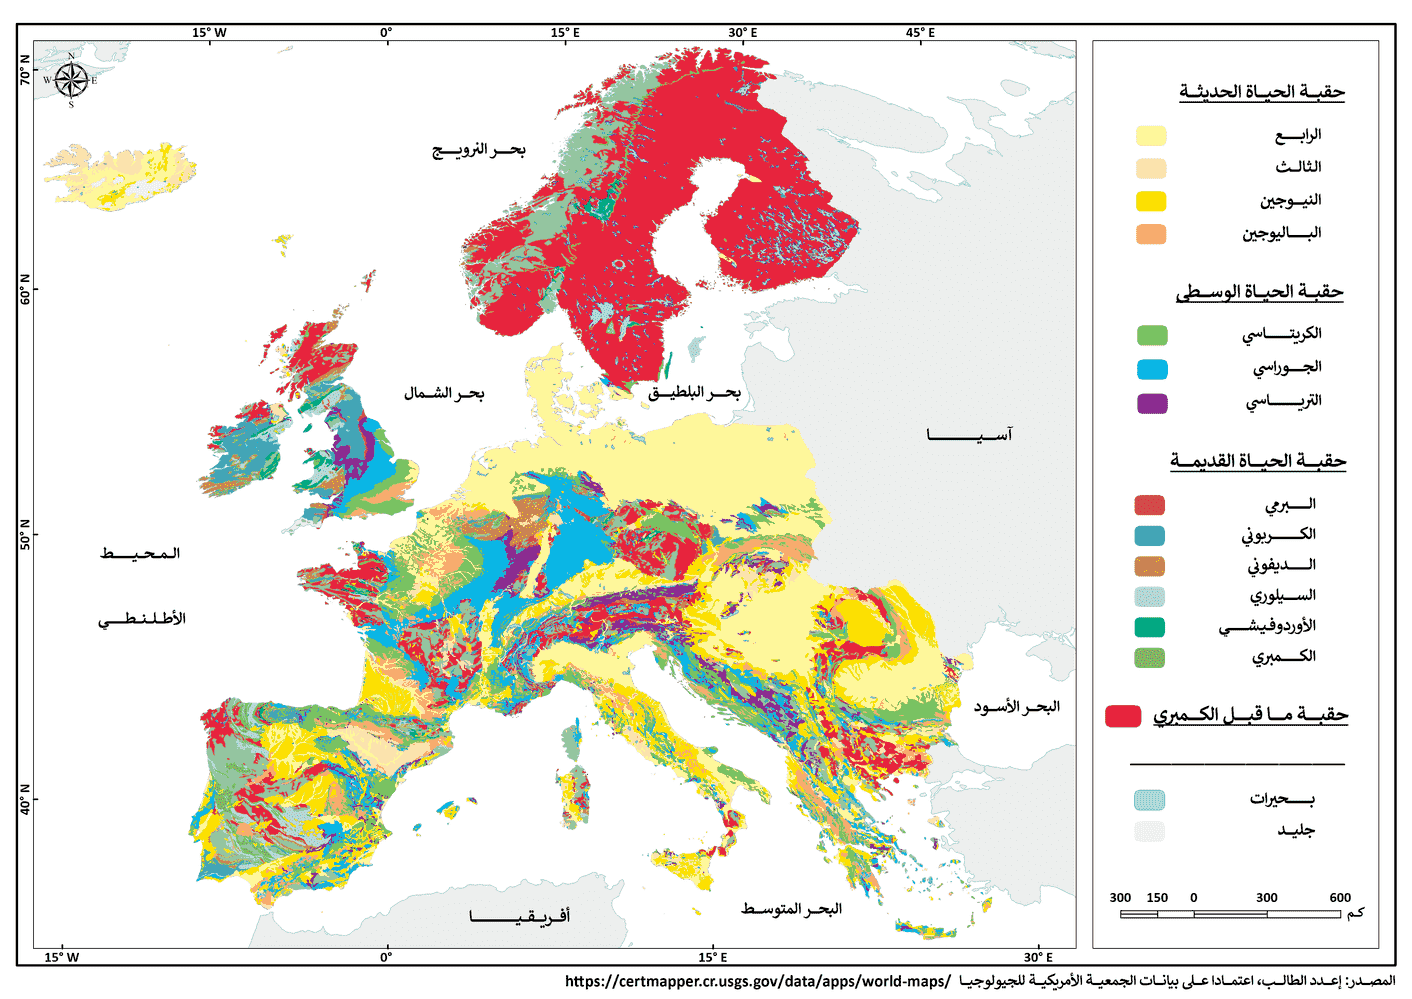
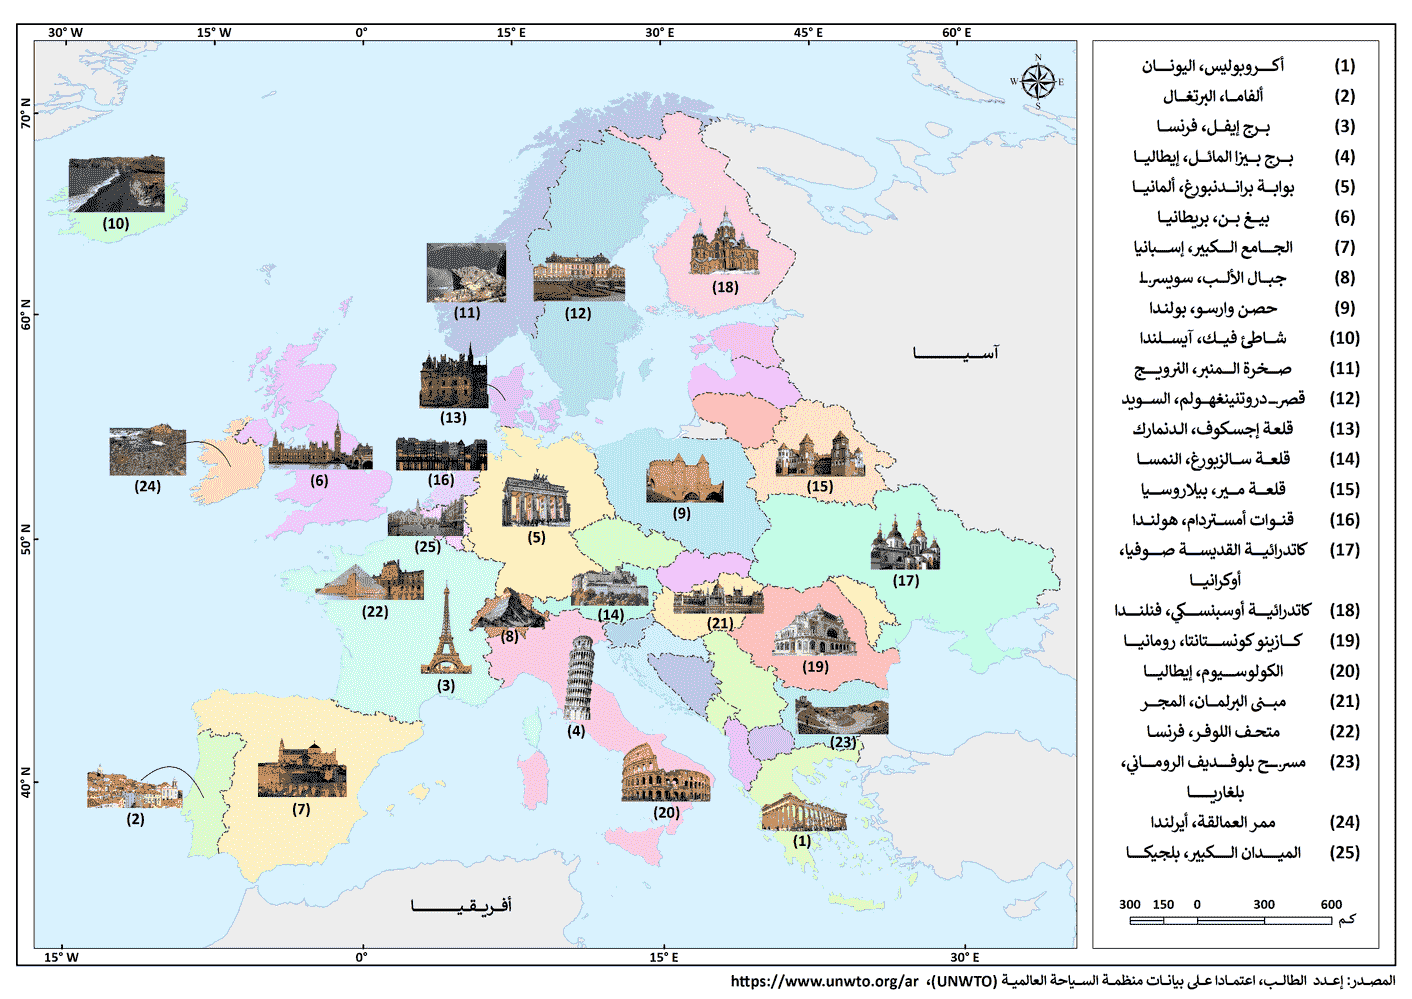
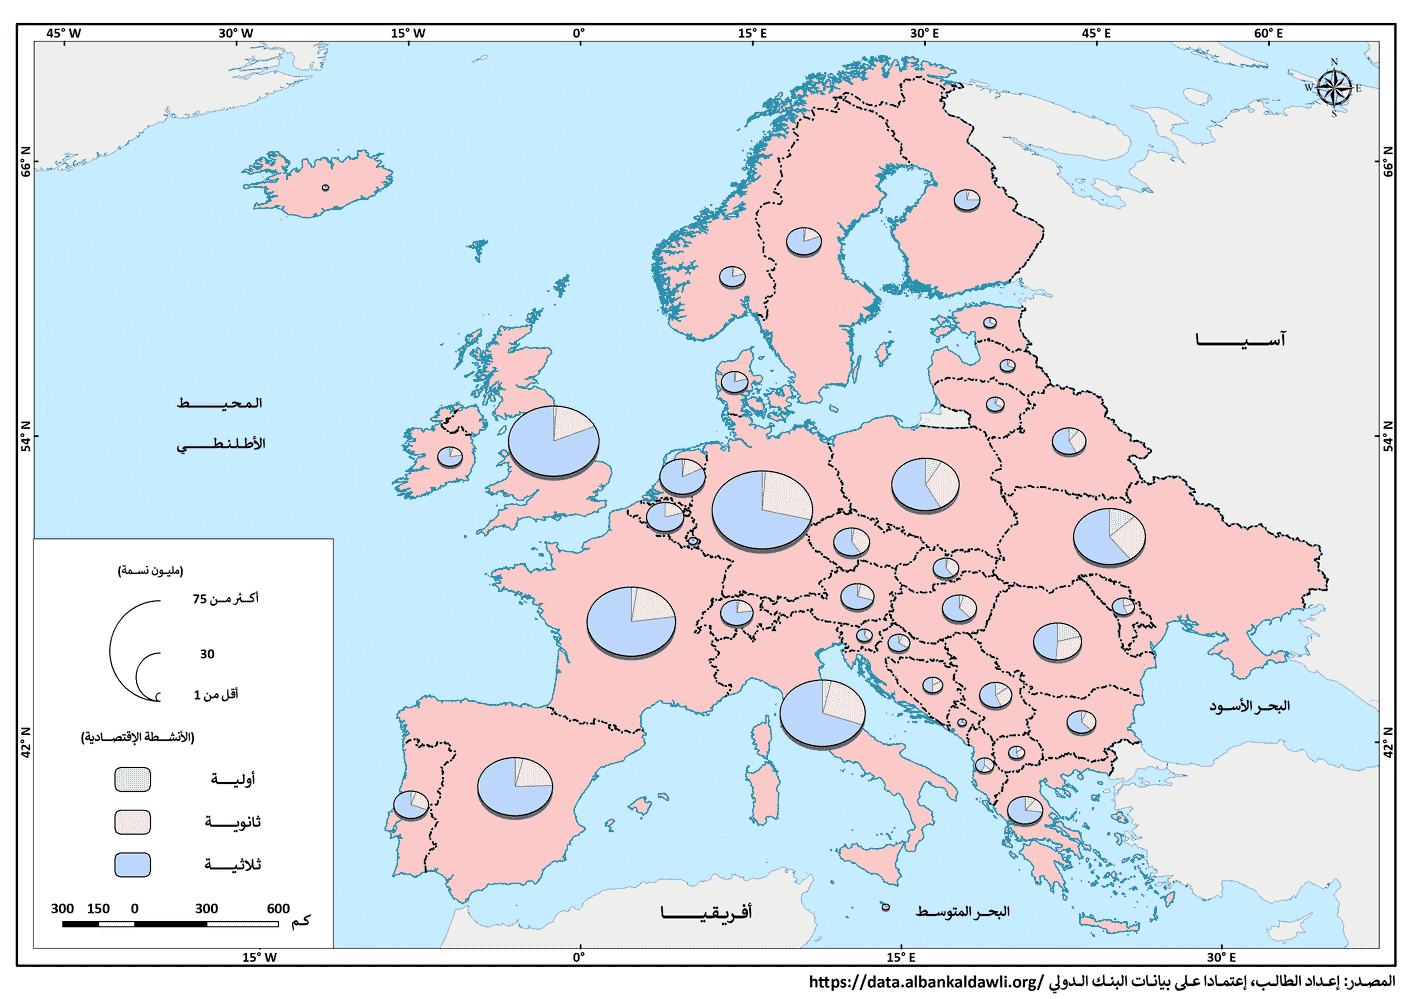
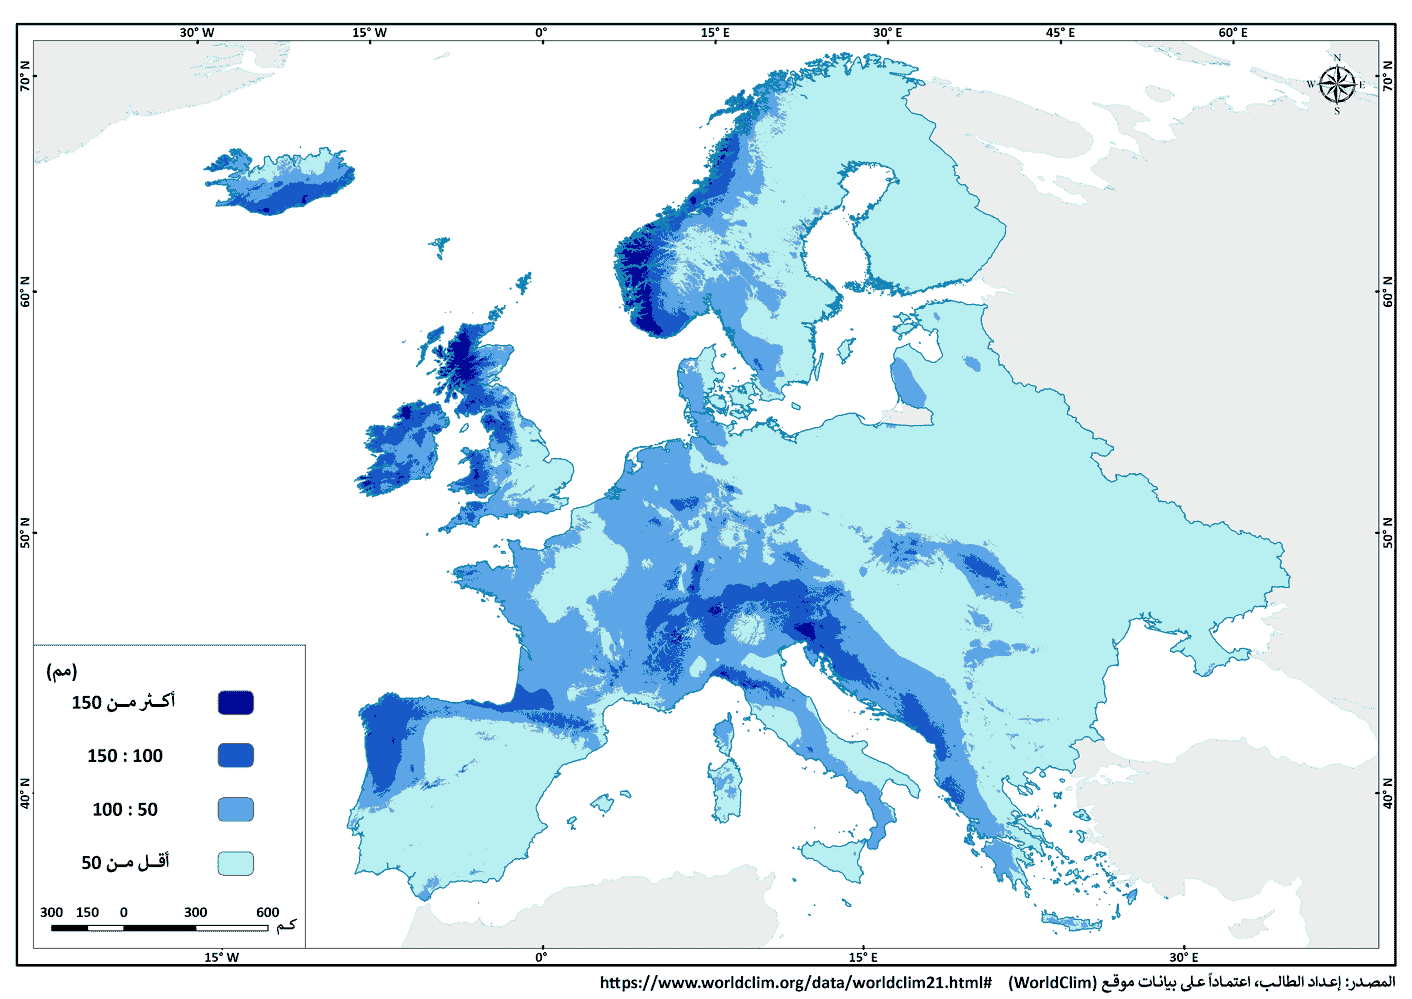
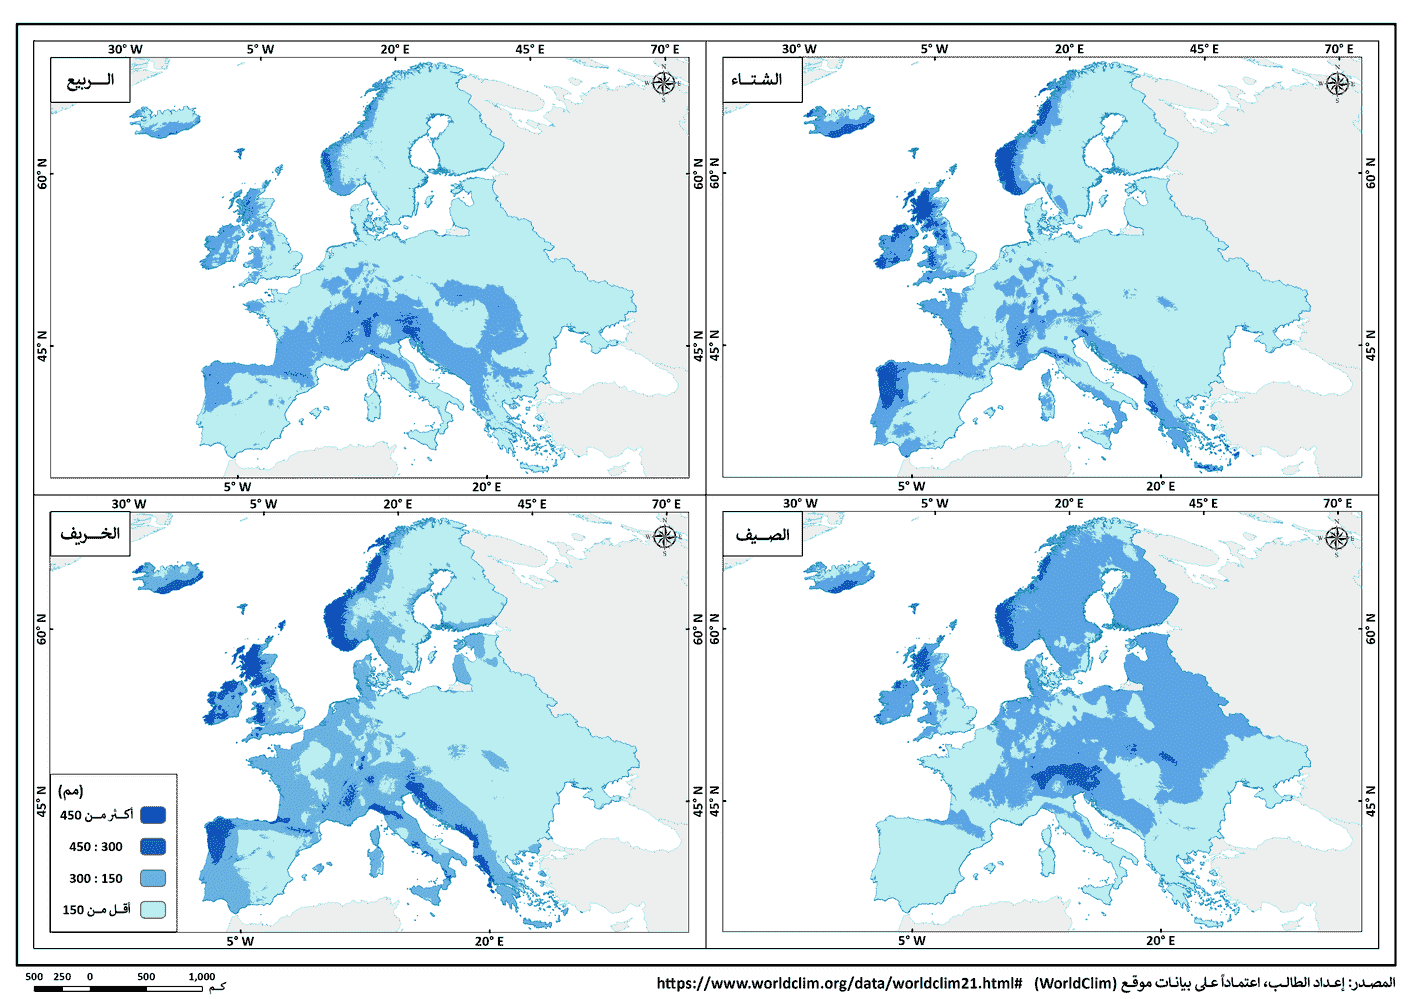
World Atlas was prepared by Maps and GIS Division at Cairo University. It contains more than 100 maps of more than 220 countries, which includes the natural, human, and economic geographical aspects of these countries.
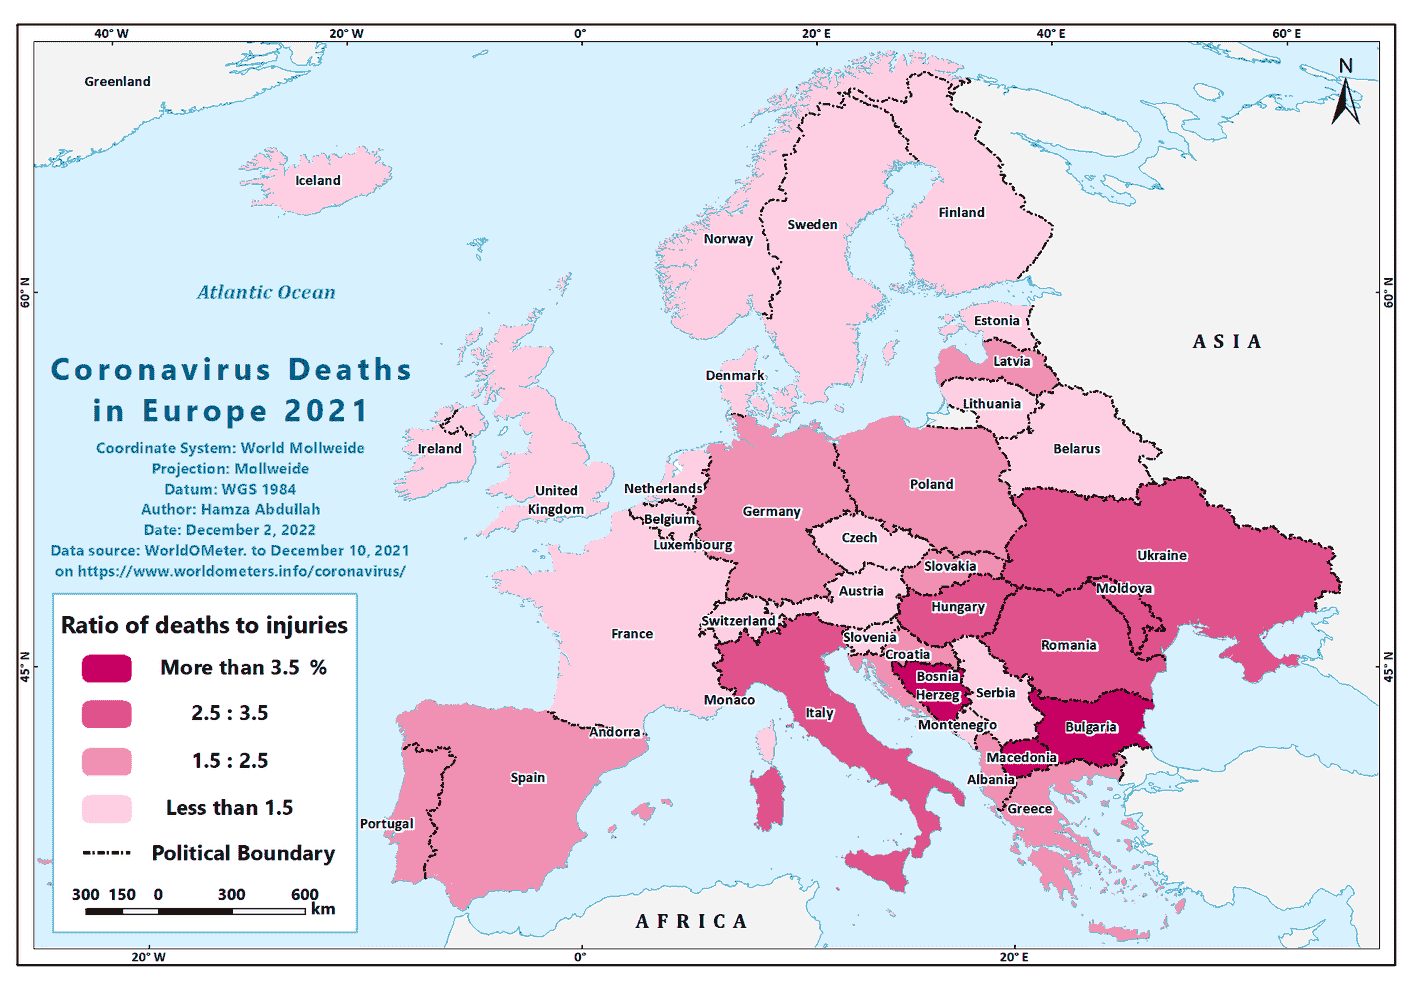
For example, the atlas includes maps of the geological structure, topography, climate, water resources, demography maps, urban growth, national income, human development, transportation, and communications, plus new maps related to universal health coverage, such as maps of the Coronavirus.
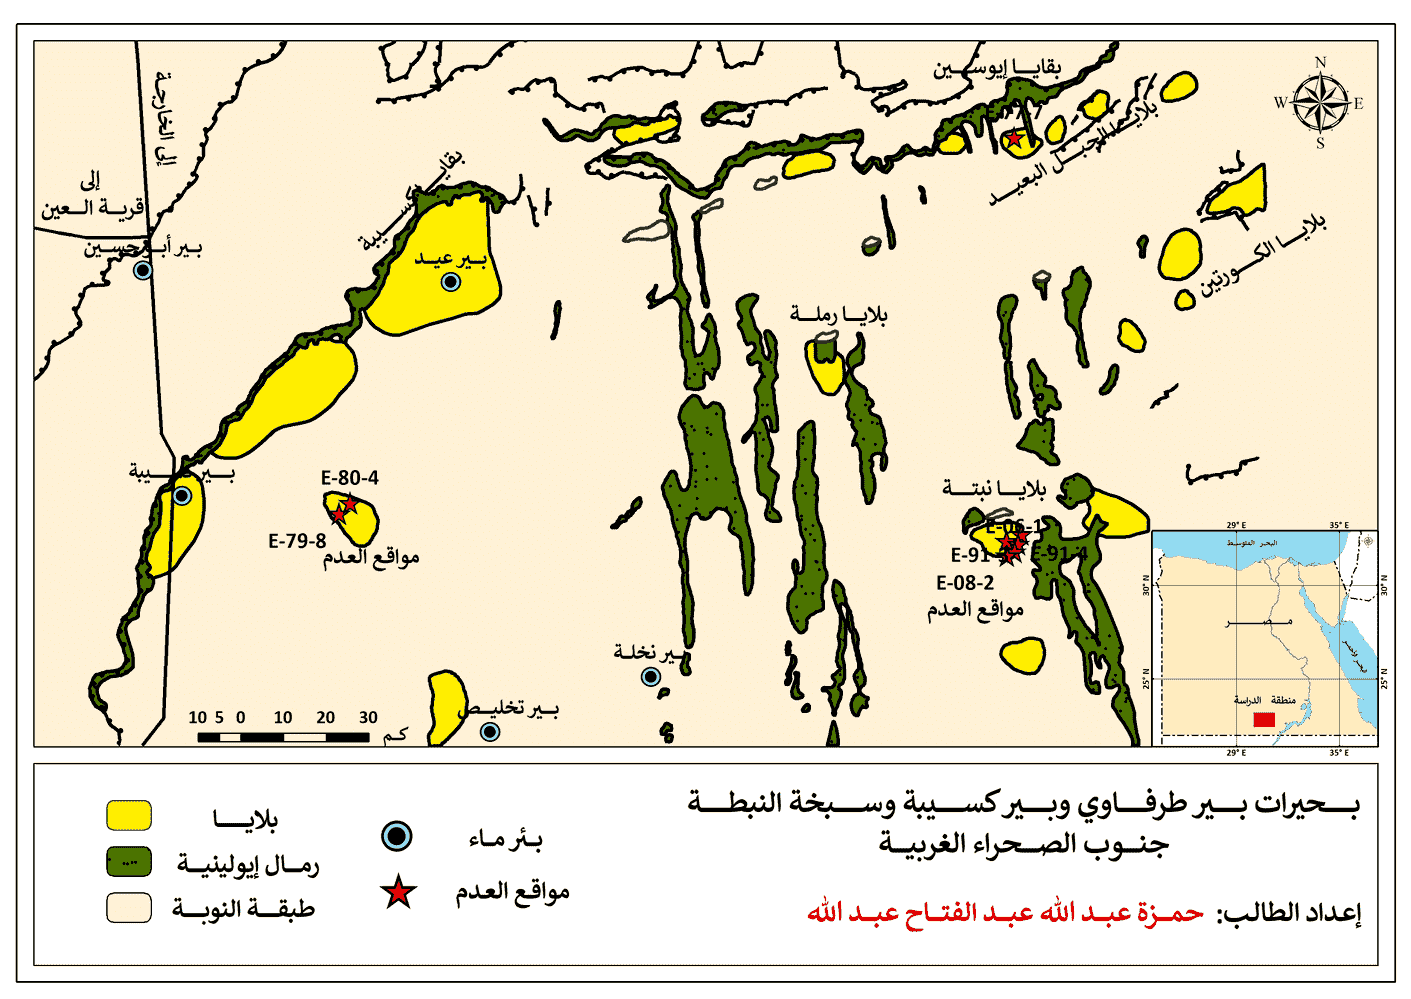
My tasks were :

human field studies are used to understand how people interact with and are affected by their physical environment. This type of research is particularly useful for understanding issues such as urbanization, land use and land cover change, environmental degradation, and sustainability.
A human field study in geography typically involves studying a specific area or region in order to understand the ways in which people are using the land, as well as the social, economic, and cultural factors that influence their use of the environment. Researchers may use a variety of methods in a human field study in geography, including Participant observation, Interviews, Surveys, and using GIS to generate maps.
My tasks were :
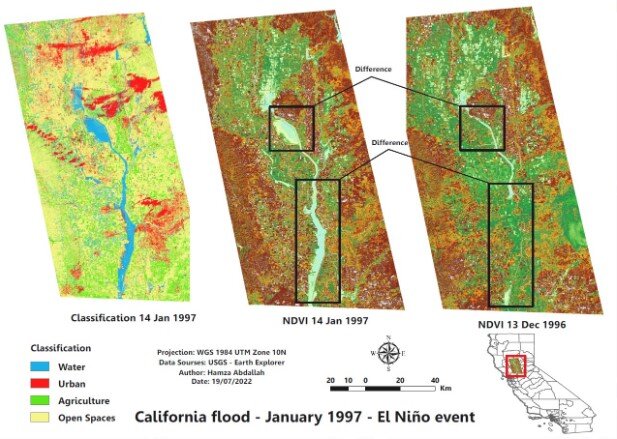
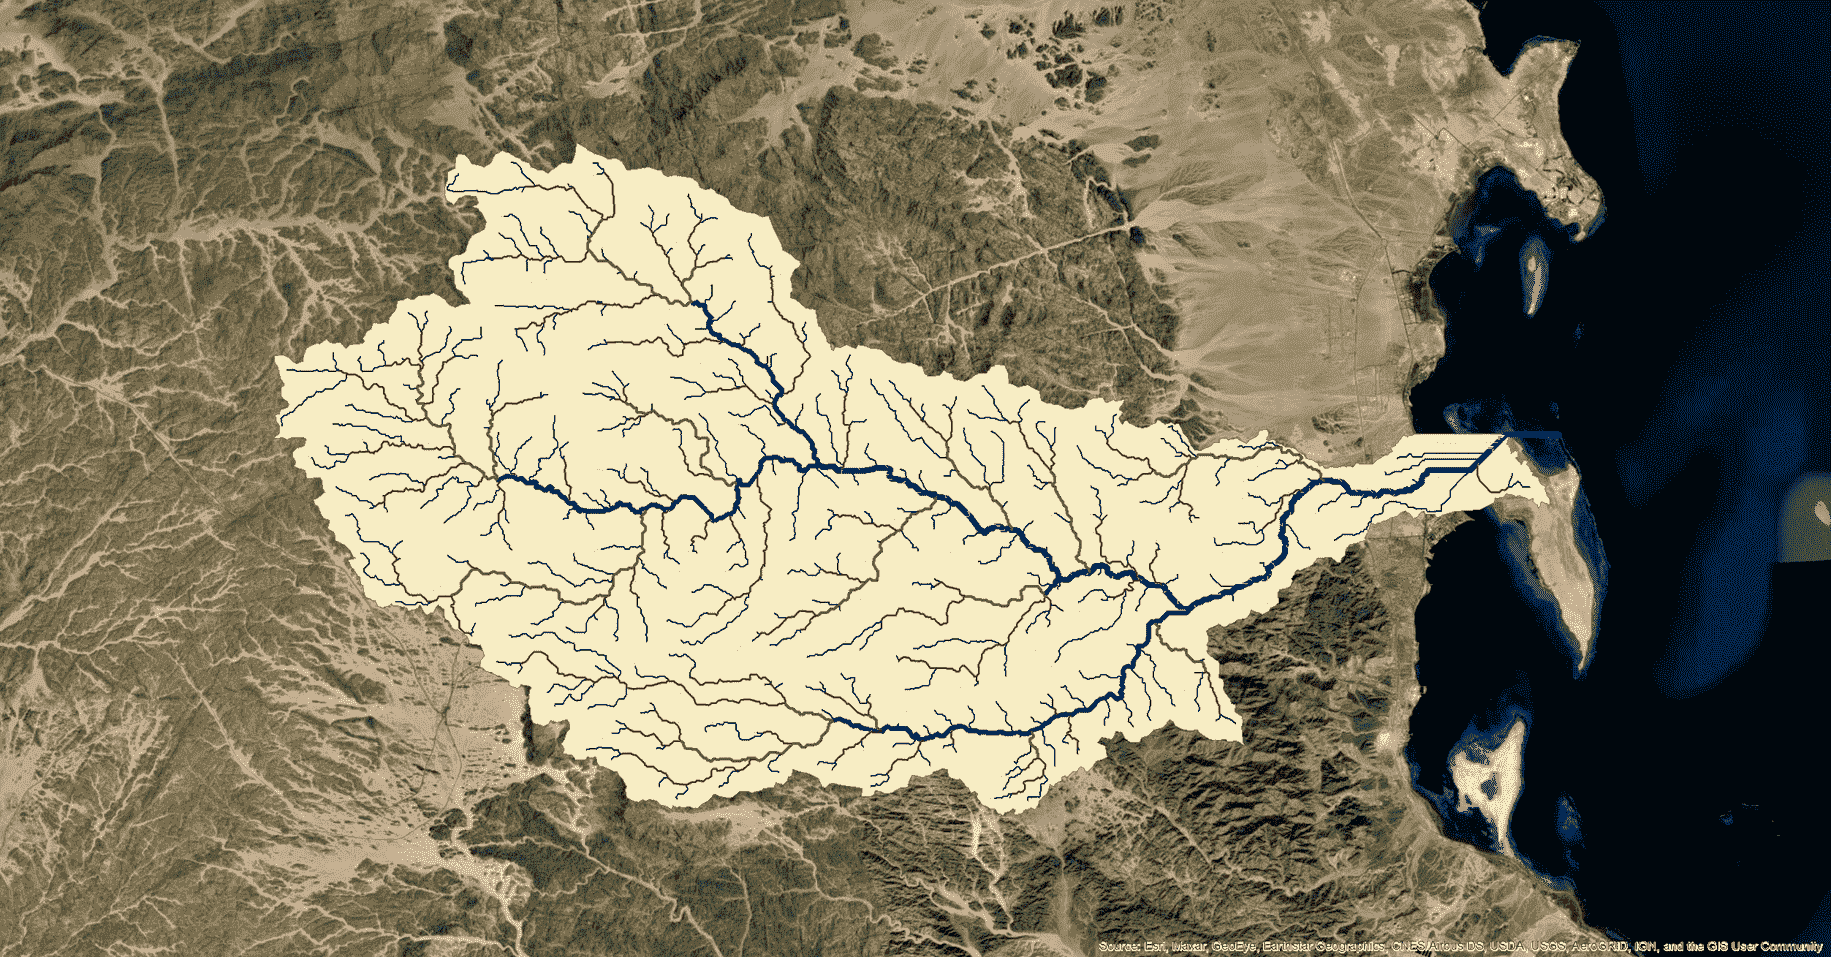
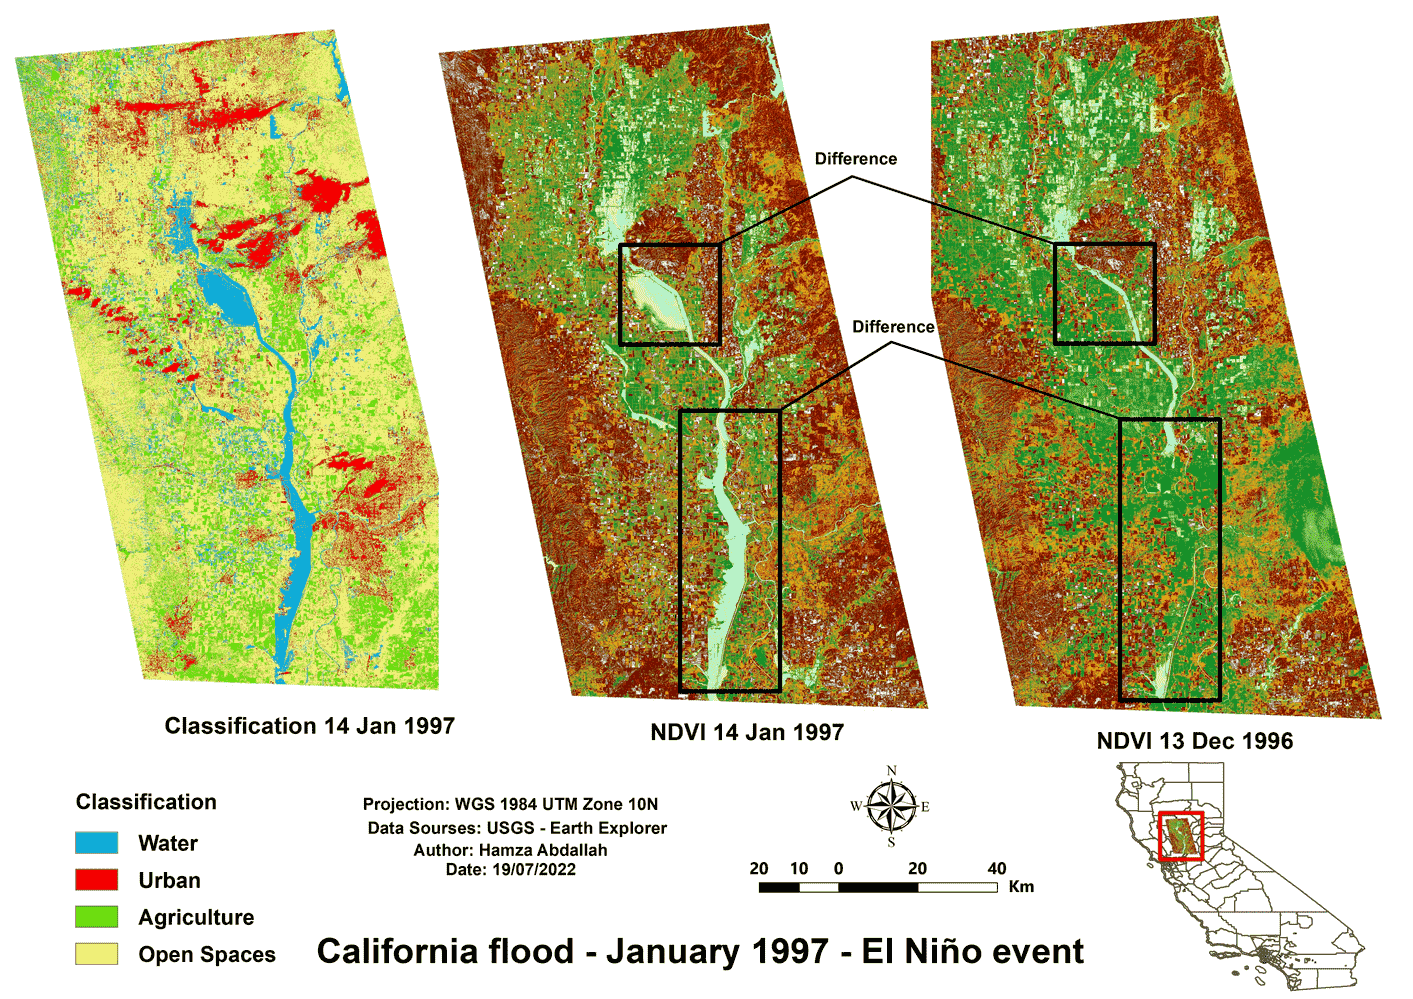
Flood of January 1997 in the Lake Tahoe Basin, California and Nevada
Northern California and western Nevada, including the Lake Tahoe Basin, were affected by floods during January 1-3, 1997. In the two California counties surrounding Lake Tahoe, El Dorado and Placer, about $91 million in estimated damage was attributed to flood waters. Flooding in the Lake Tahoe Basin was mainly along the Upper Truckee River in the city of South Lake Tahoe.
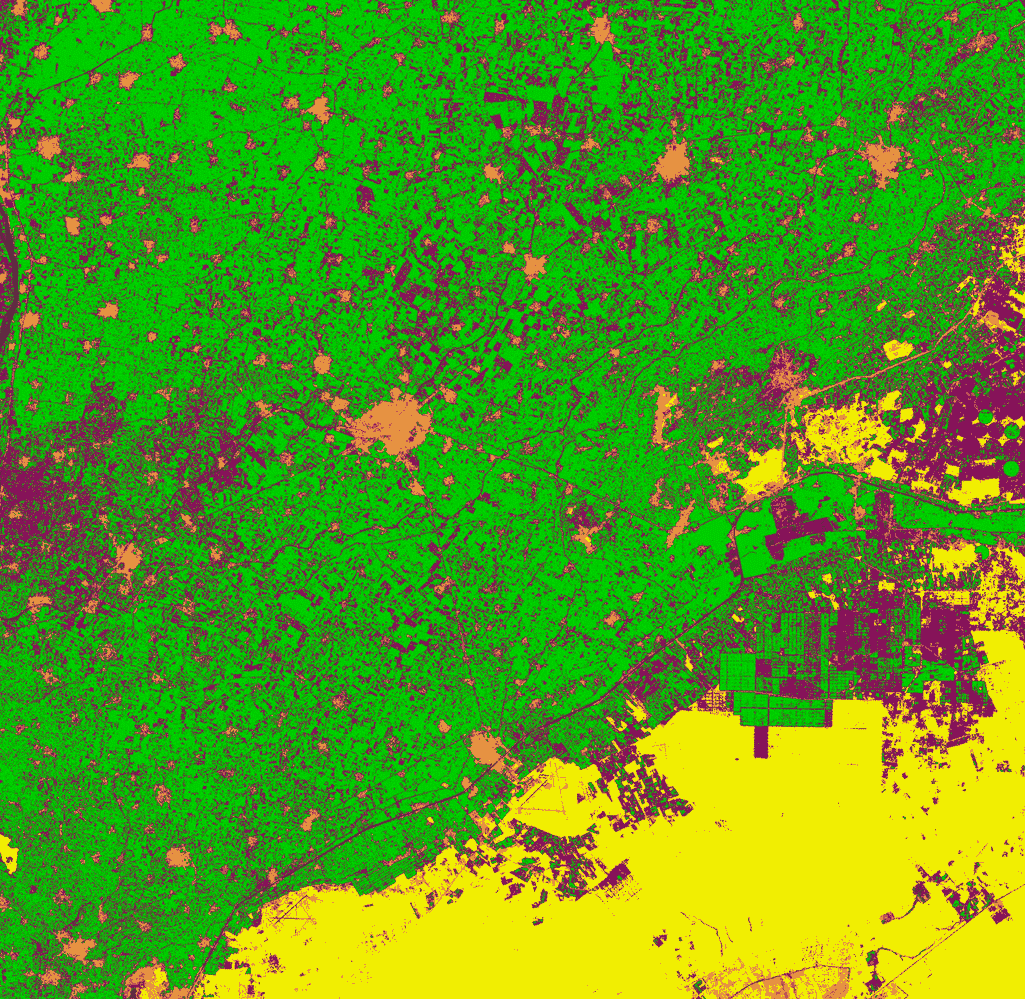
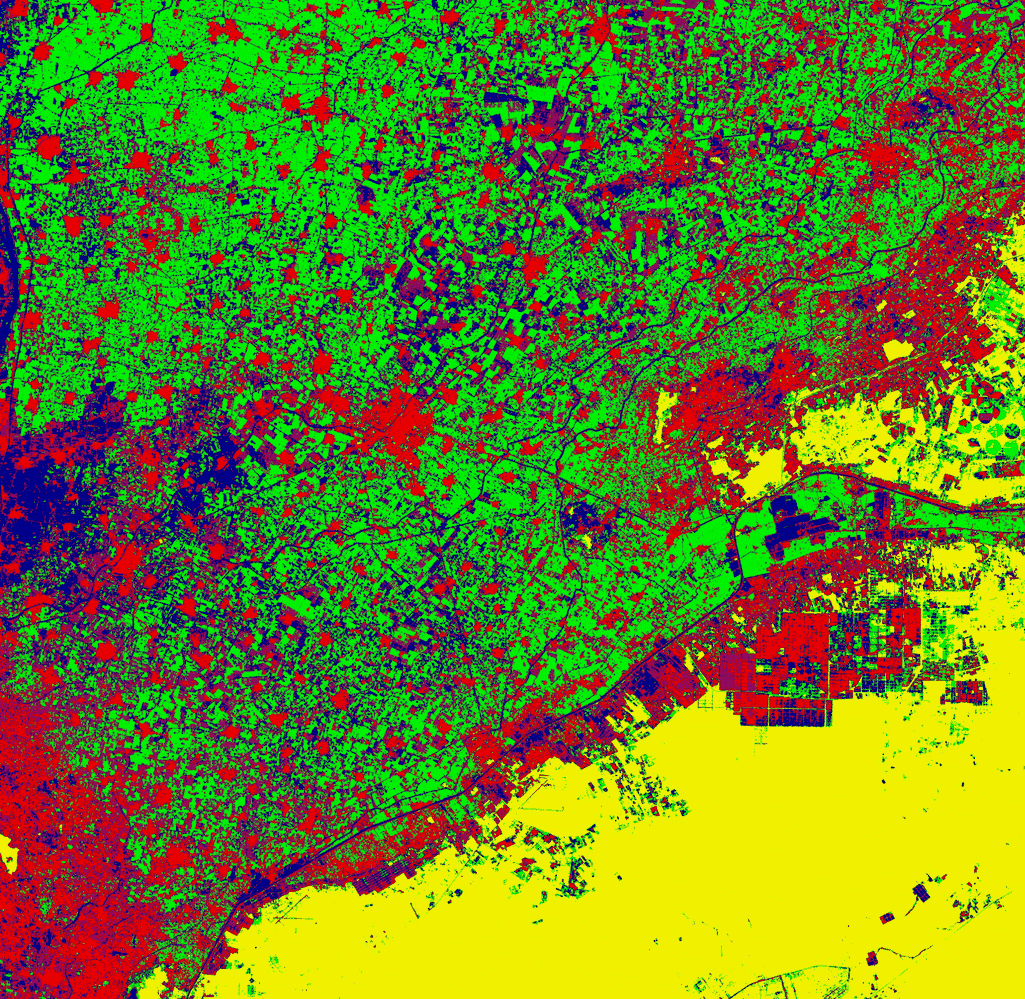
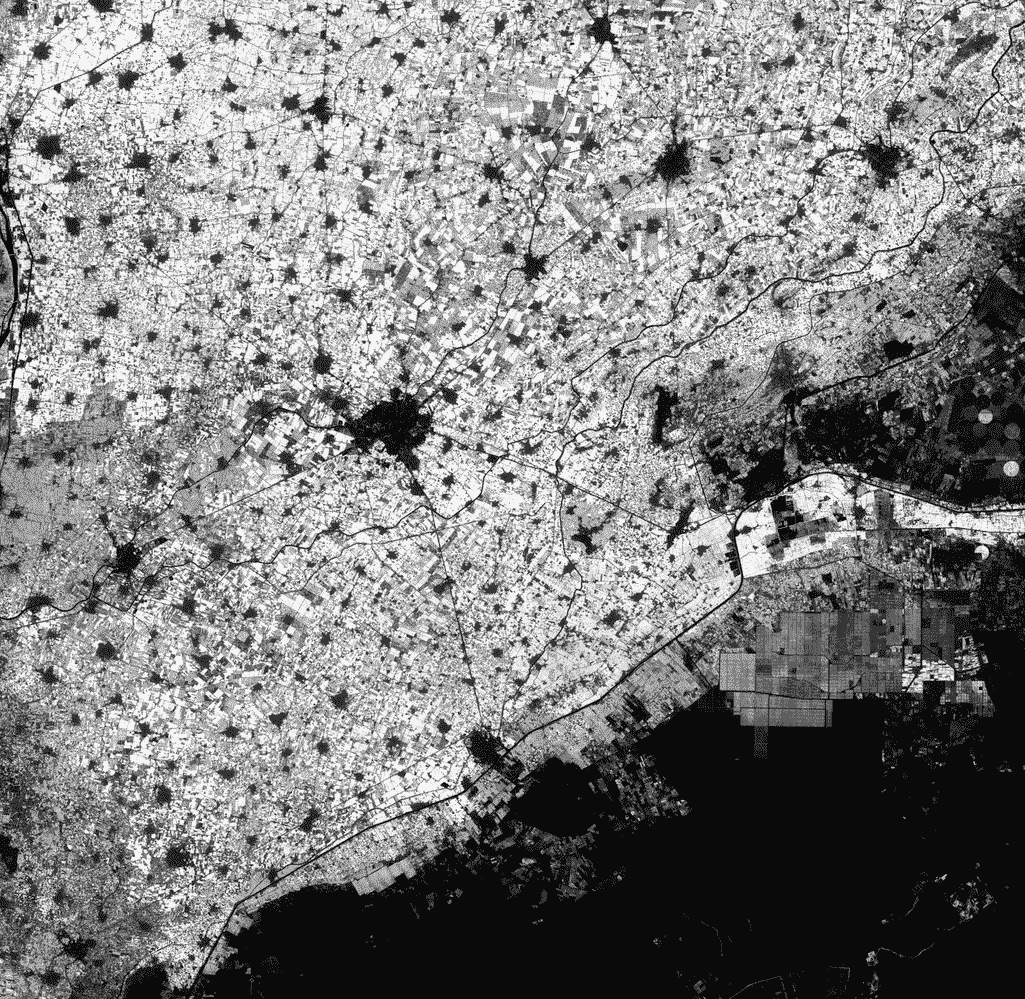
Through this analysis, the limitations on it are to make a classification of the visuals and extract the NDVI index only, for any satellite visuals, and this is not only limited to the floods in this area.
Open PDFWhen your weather app tells you it's going to be a hot day, you might think it'll be a hot day for everyone in your city. But street configuration, building materials, vegetation, and closeness to a body of water significantly impact how city residents experience the weather. A hot and sunny afternoon in a neighborhood wrapped in mature trees and with canopy cover may feel quite pleasant. But a street surrounded by parking lots and concrete apartment buildings could be scorching.
This project proposes to explore the possibility of using publicly available satellite imagery to monitor changes in temperature inside and outside the city by analyzing heat band 10 from Landsat 8 - OLI satellites in USGS Earth Explorer and accessing the air temperature inside the city to add many more parks and trees in the future to reduce altitude increasing in temperature.
Story Map Cover
Swipe between satellite image and UHI image
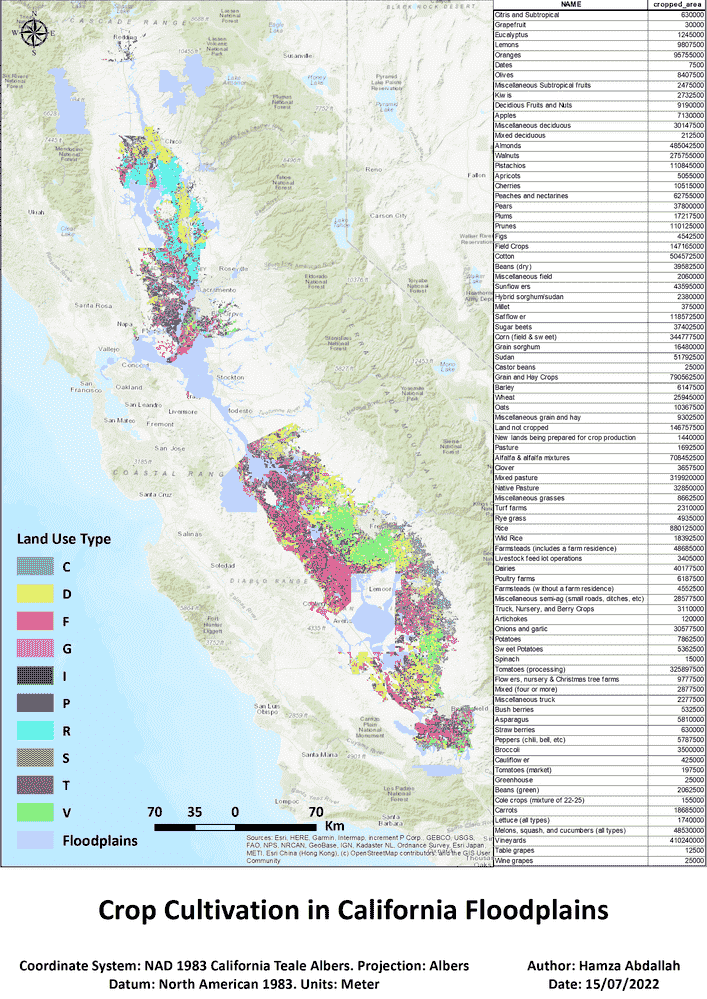
 in food in California.png)